


 61 / 164

Annual Report 2015 61
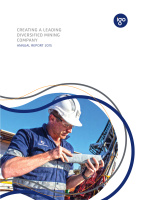
Table 5: Long Operation – June 2015 Mineral Resources (and 2014 comparison)
Mineral Resource – 30 June 2014
Mineral Resource – 30 June 2015
Classification
Tonnes
Ni %
Contained Ni
Tonnes
Tonnes
Ni %
Contained Ni
Tonnes
Long
Measured
70,000
5.5
3,900
65,000
5.4
3,500
Indicated
270,000
5.5
15,000
287,000
5.1
14,600
Inferred
138,000
5.4
7,400
355,000
4.7
16,700
Sub-Total
478,000
5.5
26,300
707,000
4.9
34,800
Victor South
Measured
-
-
-
-
-
-
Indicated
188,000
2.0
3,700
147,000
2.1
3,100
Inferred
28,000
1.6
400
33,000
1.5
500
Sub-Total
216,000
1.9
4,100
180,000
2.0
3,600
McLeay
Measured
74,000
6.7
4,900
63,000
6.3
4,000
Indicated
85,000
4.8
4,100
71,000
4.9
3,500
Inferred
75,000
4.6
3,400
21,000
6.7
1,400
Sub-Total
234,000
5.3
12,400
155,000
5.7
8,900
Moran
Measured
285,000
7.3
20,800
234,000
6.6
15,500
Indicated
90,000
6.9
6,300
51,000
3.3
1,700
Inferred
86,000
4.0
3,500
52,000
3.7
1,900
Sub-Total
461,000
6.6
30,600
337,000
5.7
19,100
Stockpiles
Measured
3,000
3.3
100
-
-
-
GRAND TOTAL
1,392,000
5.3
73,400
1,379,000
4.8
66,400
Notes:
1.
Mineral Resources are reported using a 1% Ni cut-off grade except for the Victor South disseminated Mineral Resource which is reported
using a cut-off grade of 0.6% Ni.
2.
Mining as at 30 June 2015 has been removed from the 2015 Resource estimate.
3.
Resources are inclusive of Reserves.
4.
Ore tonnes have been rounded to the nearest thousand tonnes and nickel tonnes have been rounded to the nearest hundred tonnes. This
may result in slight rounding differences in the total values in the table above.
5.
The Competent Persons statement is incorporated in the JORC Code (2012) Competent Persons Statements section of this report.
6.
JORC Code (2012) Table 1 Parameters are in IGO’s ASX release of 28 October 2015.
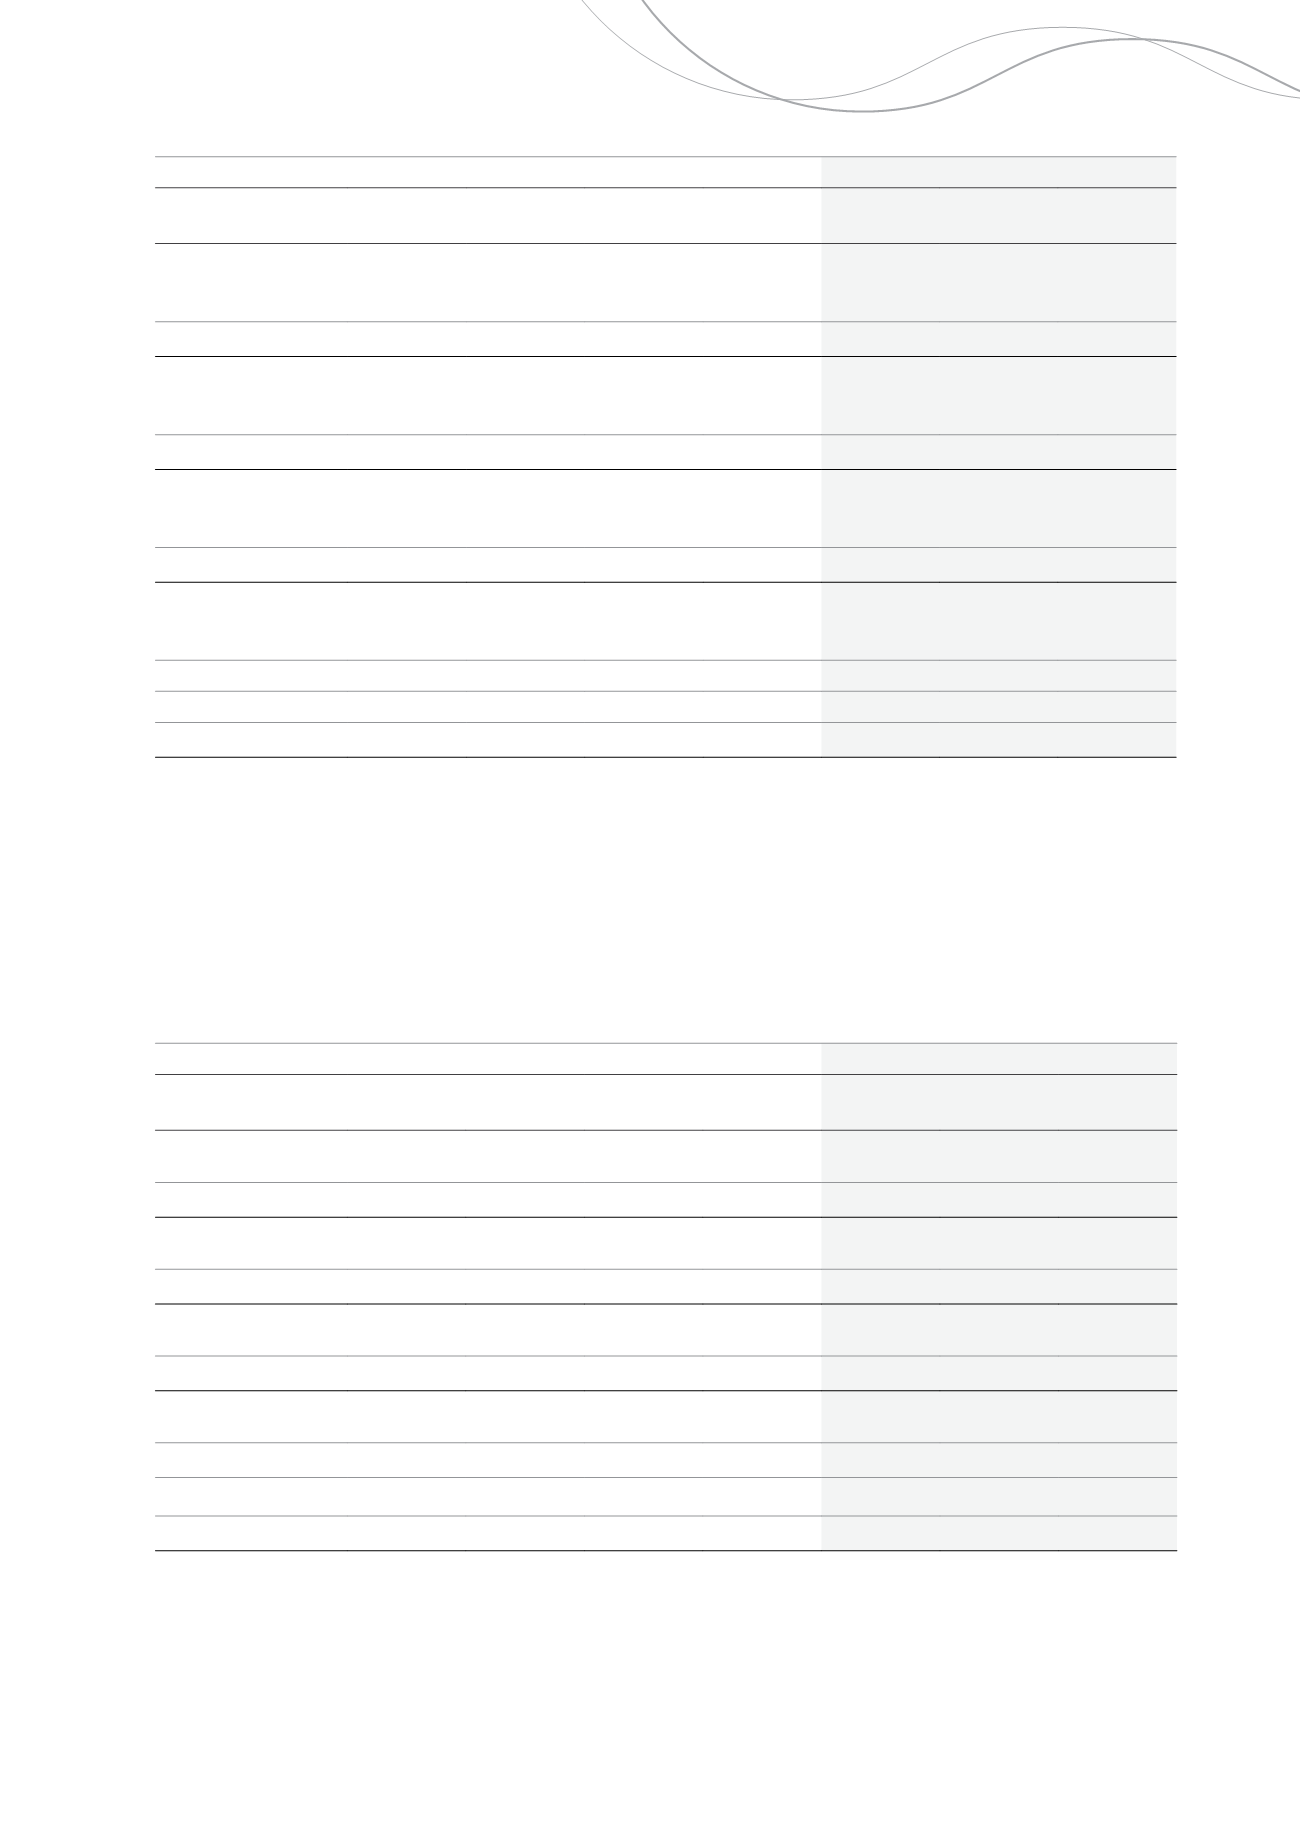
Table 6: Long Operation – June 2015 Ore Reserves (and 2014 comparison)
Ore Reserve – 30 June 2014
Ore Reserve – 30 June 2015
Classification
Tonnes
Ni %
Contained Ni
Tonnes
Tonnes
Ni %
Contained Ni
Tonnes
Long
Proved
50,000
3.8
1,900
28,000
3.6
1,000
Probable
56,000
3.1
1,700
94,000
2.8
2,600
Sub-Total
106,000
3.4
3,600
122,000
3.0
3,600
Victor South
Proved
5,000
3.7
200
7,000
3.0
200
Probable
8,000
3.2
200
15,000
2.2
300
Sub-Total
13,000
3.4
400
22,000
2.5
500
McLeay
Proved
49,000
4.1
1,900
22,000
3.5
800
Probable
3,000
3.3
100
24,000
3.1
700
Sub-Total
52,000
3.9
2,000
46,000
3.3
1,500
Moran
Proved
449,000
4.5
20,200
380,000
4.0
15,200
Probable
120,000
3.1
3,600
38,000
3.0
1,200
Sub-Total
569,000
4.2
23,800
418,000
3.9
16,400
Stockpiles
Proved
3,000
3.3
100
-
-
-
GRAND TOTAL
743,000
4.0
29,900
608,000
3.6
22,000
Notes:
1.
Ore Reserves are reported above an economic Ni cut-off value as at 30 June.
2.
A Net Smelter Return (NSR) value of $169 per ore tonne has been used in the evaluation of the 2015 Reserve.
3.
Mining as at 30 June 2015 has been removed from the 2015 Reserve estimate.
4.
Ore tonnes have been rounded to the nearest thousand tonnes and nickel tonnes have been rounded to the nearest hundred tonnes.
5.
Revenue factor inputs (US$): Ni $19,678/t, Cu $6,323/t. Exchange rate AU$1.00 : US$0.77.
6.
The Competent Persons statement is incorporated in the JORC Code (2012) Competent Persons Statements section of this report.
7.
JORC Code (2012) Table 1 Parameters are in IGO’s ASX release of 28 October 2015.