


 7 / 164

Annual Report 2015 7
FY2015 SCORECARD – STRATEGIC METRICS
Objective
Achieved
$ million
Score
$26M Brownfields exploration
25.7
$27M Sustaining capex
24.4
$11M Development capex
11.4
•
(1)
$11M Greenfields exploration
11.5
•
(2)
$3M Stockman development
0.8
Supplement exploration portfolio with mature projects
WIP*
•
(3)
Advance Stockman through permitting to decision
WIP*
•
(4)
Consider project acquisition or JV
Sirius
(1)
Committed to additional work to accelerate vertical development and develop drill drive at Jaguar
(2)
Committed to additional work at Salt Creek JV
(3)
Reduced long list of prospective areas to short list, now doing detailed assessments
(4)
Key approval from Minister for Planning obtained, now doing detailed permitting and licencing
*
WIP means work in progress
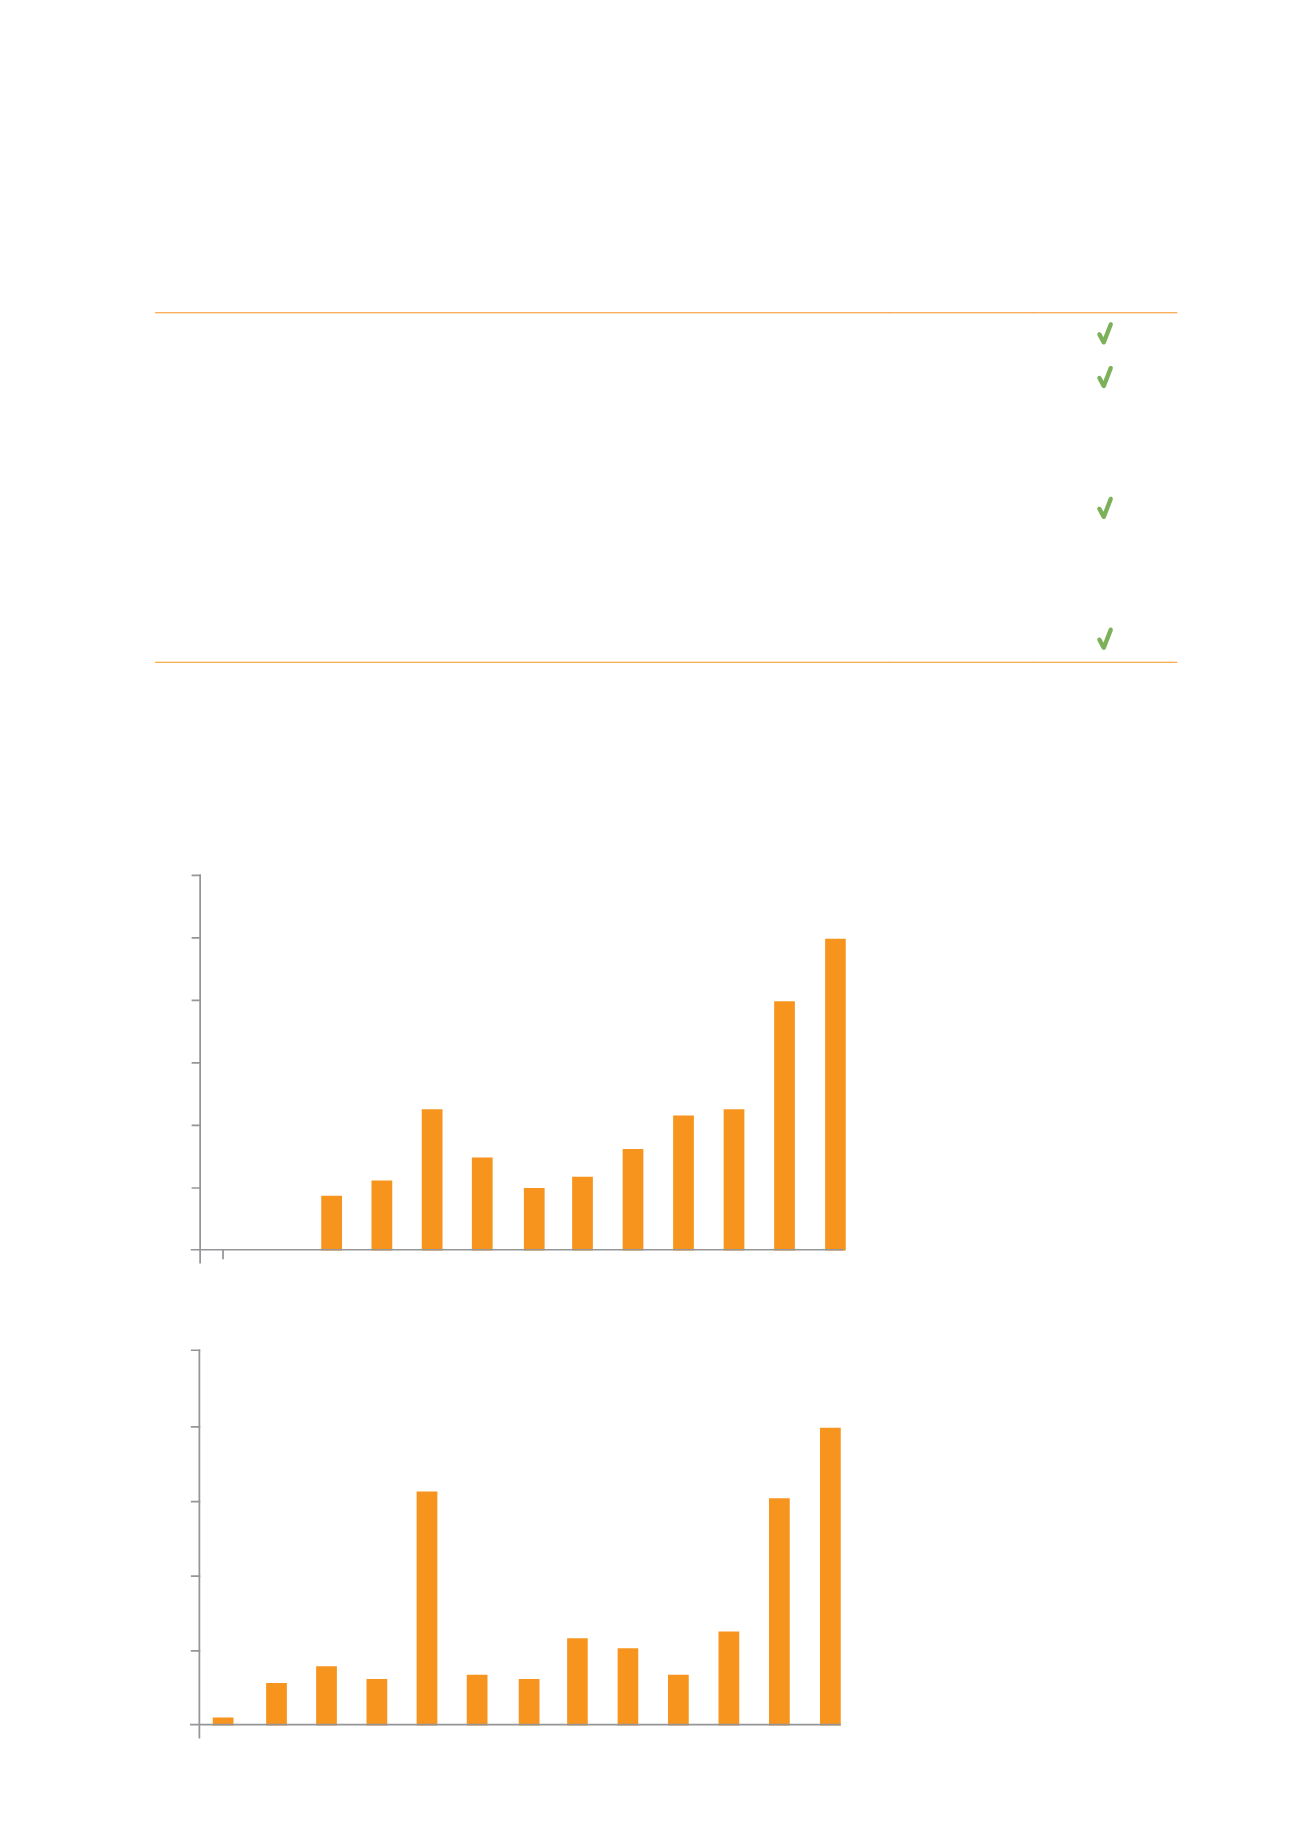
FY2015 SCORECARD – A HISTORY OF GROWING REVENUE AND CASH FLOW
Annual Revenue ($M)
03 04 05 06 07 08 09 10 11
12 13 14 15
600
500
400
300
200
100
-
Annual Net Cash Flow from Operating Activities ($M)
03 04 05 06 07 08 09 10 11
12 13 14 15
250
200
150
100
50
-
$M
Year
Year
$M