


 46 / 164

46 Independence Group NL
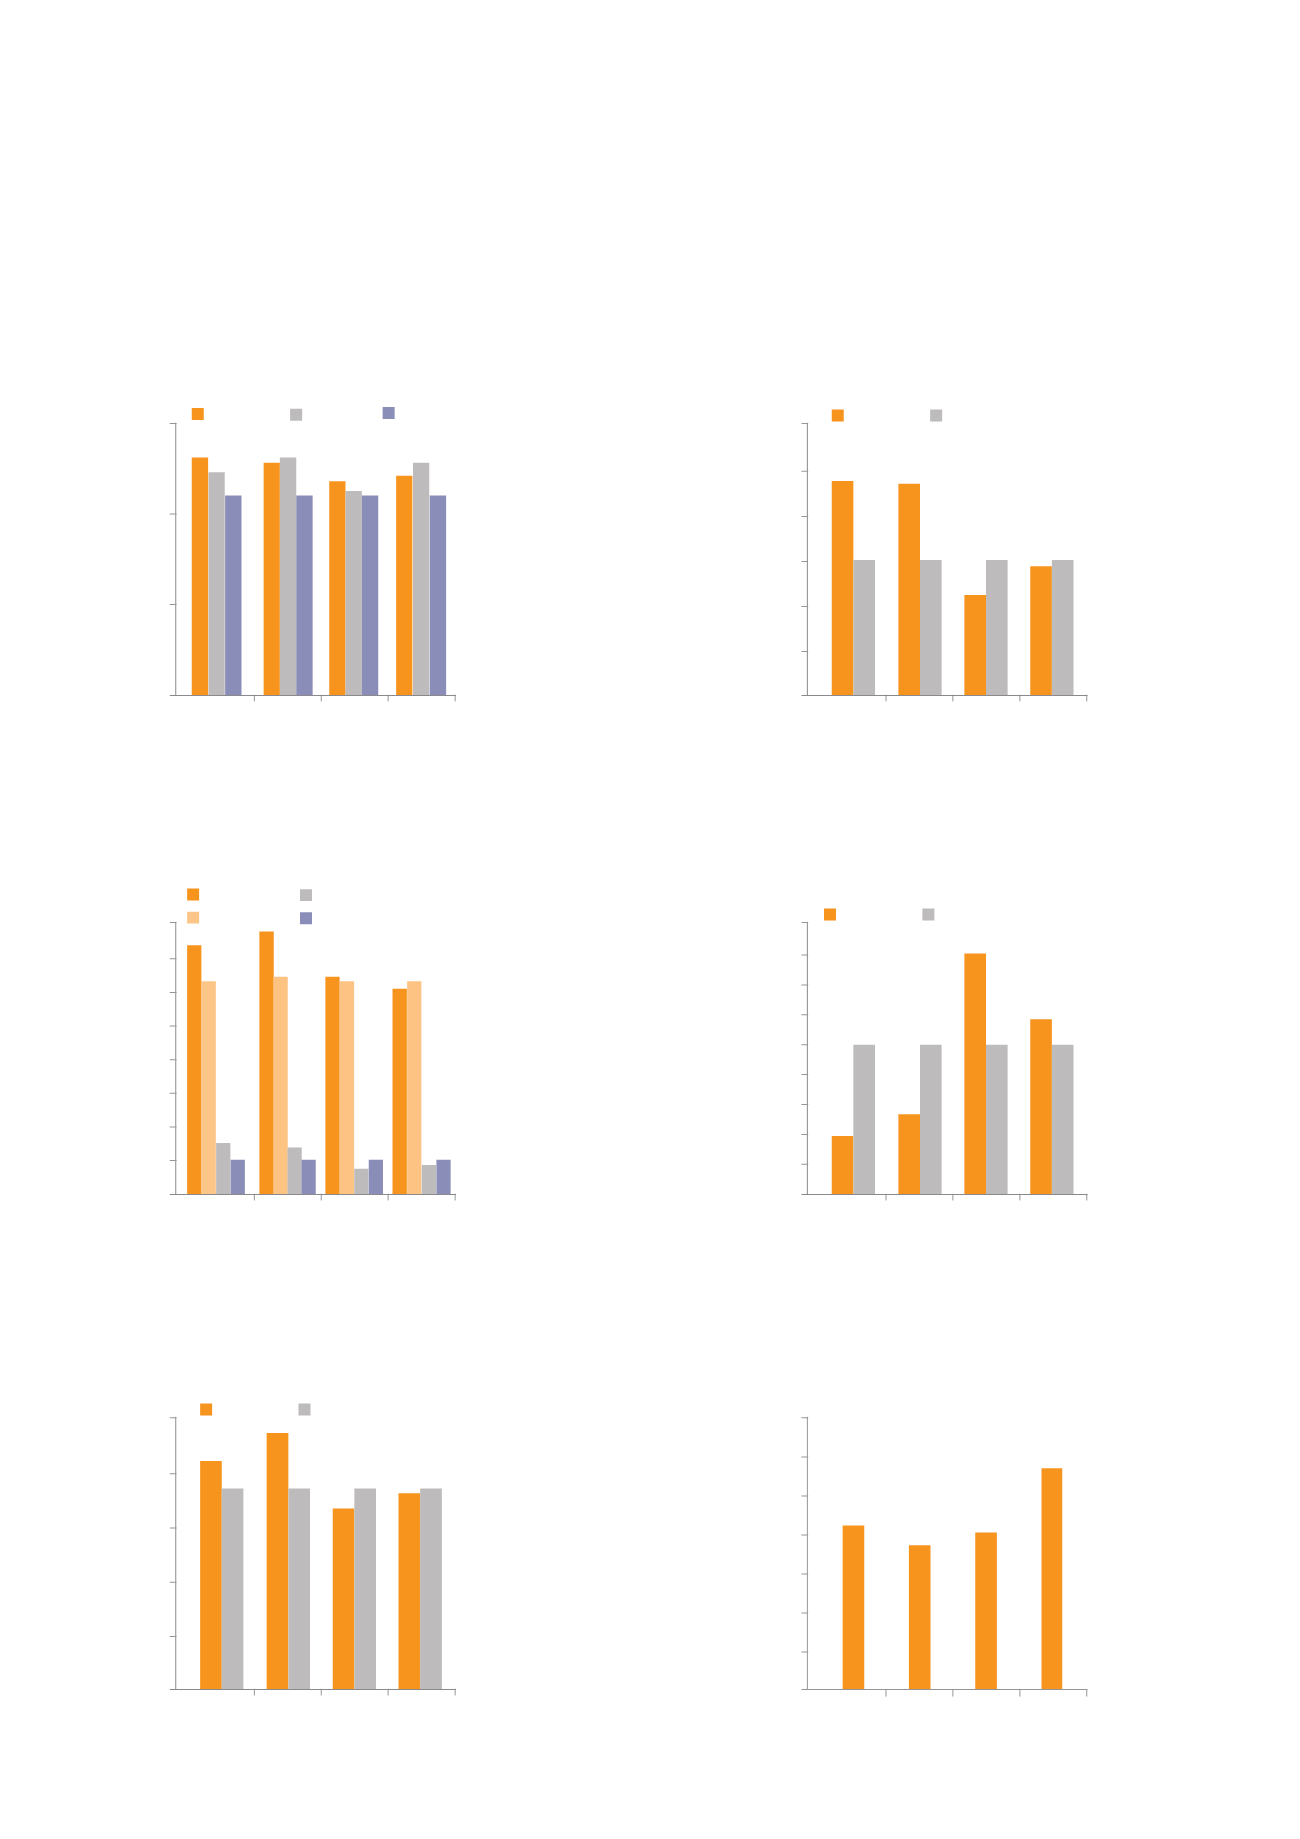
FY2015 Scorecard
Annual zinc and copper production and cash costs better than original FY2015 guidance
Ore Mined and Ore Milled (kt)
Q4
Q2
Q3
Q1
Ore Mined Ore Milled Guidance
150
100
50
0
Cash Costs $/lb Zn Payable
Q4
Q2
Q3
Q1
Actual
Guidance Midpoint
0.9
0.8
0.7
0.6
0.5
0.4
0.3
0.2
0.1
0
Zn Production in Concentrate (t)
Q4
Q2
Q3
Q1
Actual
Guidance Midpoint
15,000
12,000
9,000
6,000
3,000
0
Cu Production in Concentrate (t)
Q4
Q2
Q3
Q1
Actual
Guidance Midpoint
3,000
2,500
2,000
1,500
1,000
500
0
Grade (%)
Q4
Q2
Q3
Q1
Cu Grade
Cu Guidance
Zn Grade
Guidance
12.5
10.5
9.0
7.5
6.0
4.5
3.0
1.5
0.0
Q4
Q2
Q3
Q1
Development (metres)
1,400
1,200
1,000
800
600
400
200
0