


 72 / 164

DIRECTORS’ REPORT
72 Independence Group NL
Directors' report
30 June 2015
Operating and financial review (continued)
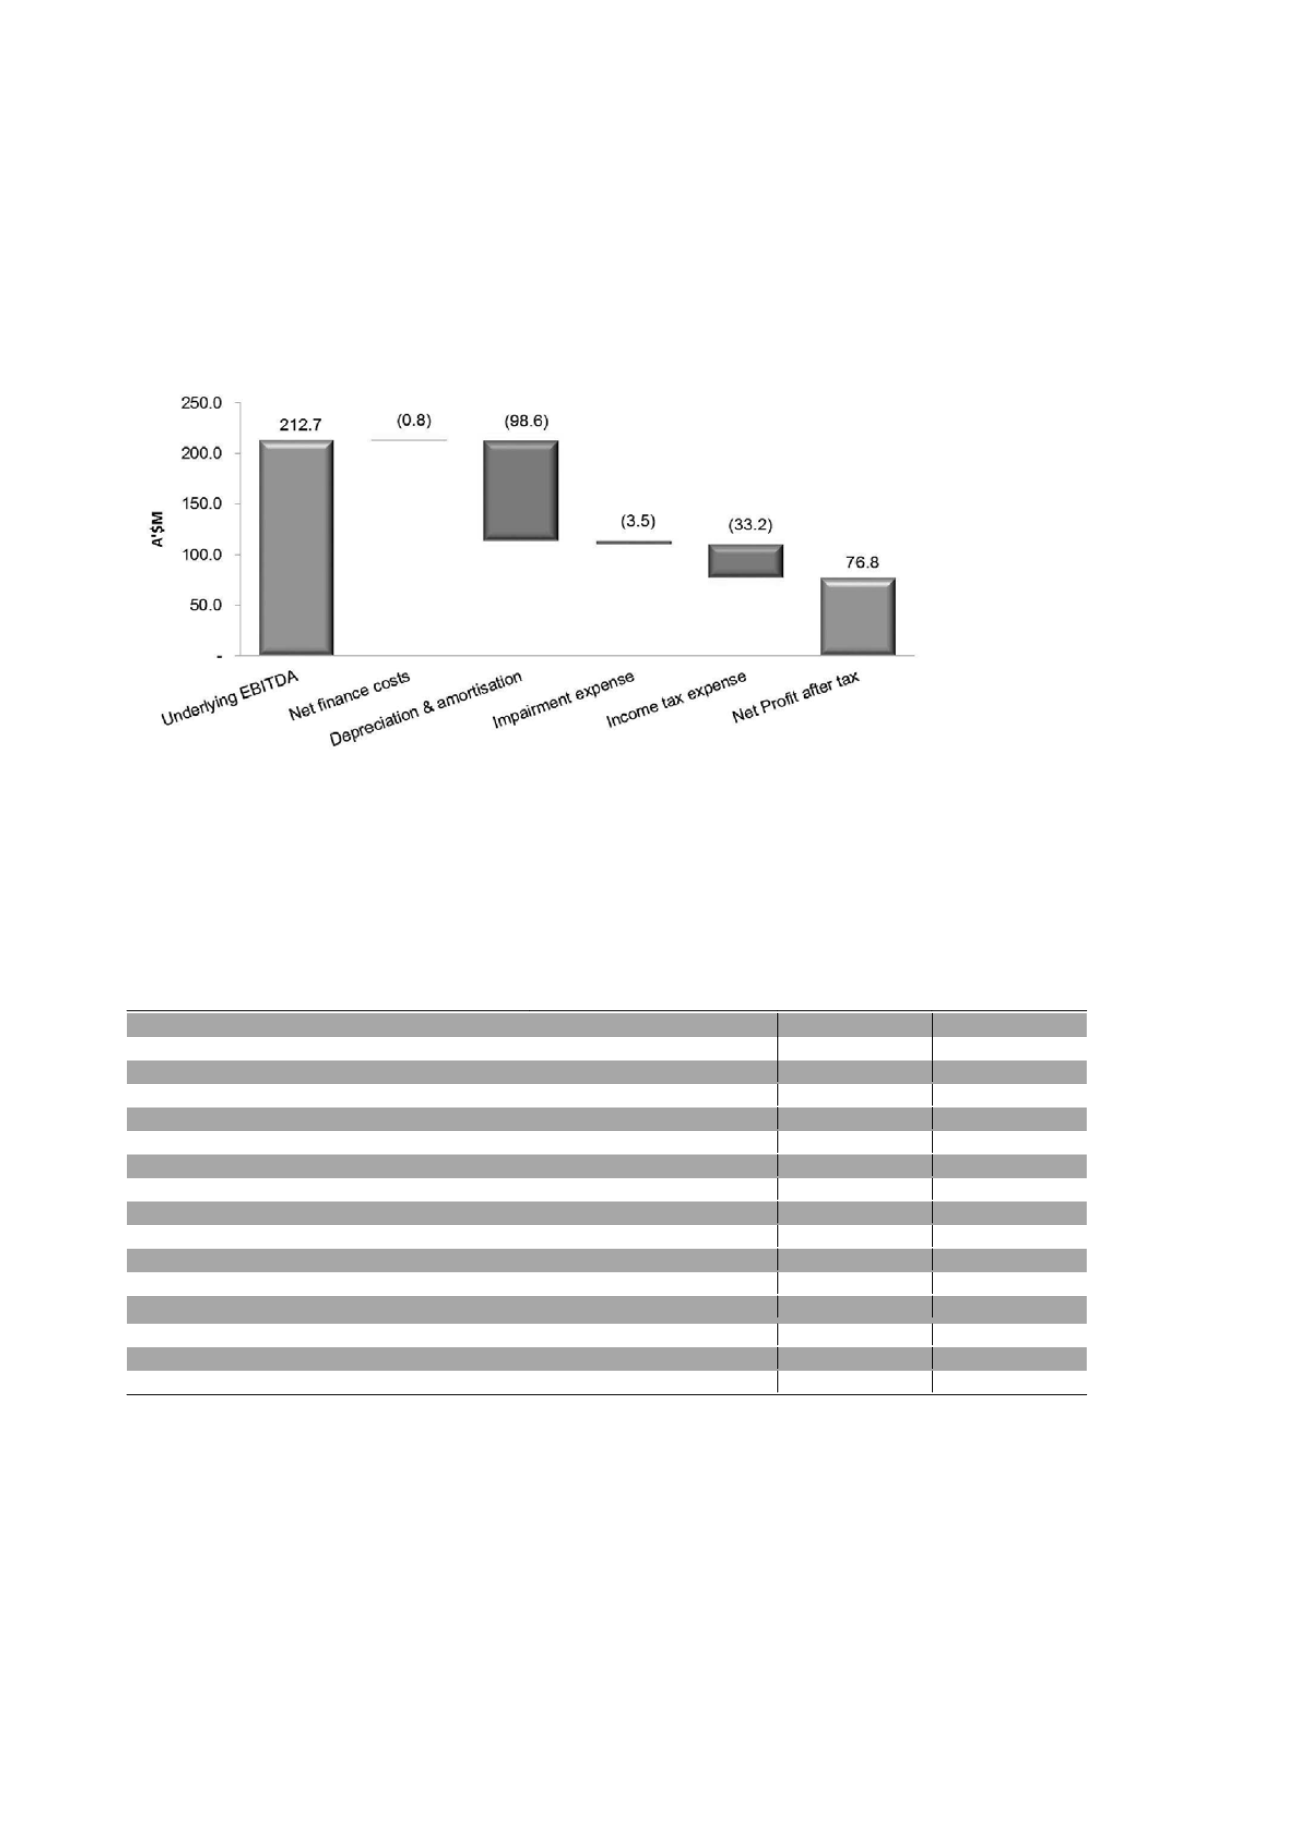
Below is a reconciliation of Underlying EBITDA to NPAT for FY2015:
Depreciation and amortisation expense (“D&A”) of $98.6 million includes $55.9 million relating to Tropicana, $21.9
million to Long Operations, $19.7 million to Jaguar Operations and the balance to corporate assets. Jaguar’s D&A
increased by 108% during the year, primarily as a result of increased amortisation from a higher proportion of ore
sourced from reserves compared to the previous year, together with additional depreciation charges following the
replenishment of the underground haulage and production fleet.
Operations
Tropicana Gold Project
The table below outlines the key results and operational statistics during the current and prior year.
Tropicana Gold Mine
2015
2014*
Total revenue
$'000
218,966
137,918
Segment operating profit before tax
$'000
76,117
48,332
Total segment assets
$'000
645,071
440,585
Total segment liabilities
$'000
31,748
29,705
Gold ore mined (>0.6g/t Au)
'000 wmt
10,763
5,721
Gold ore mined (>0.4 and 0.6g/t Au)
'000 wmt
1,601
1,088
Waste mined
'000 wmt
42,761
25,251
Gold grade mined (>0.6g/t)
g/t
2.06
2.22
Ore milled
'000 wmt
5,826
4,043
Gold grade milled
g/t
2.92
3.02
Metallurgical recovery
%
90.2
89.4
Gold recovered
Ounces
492,780
350,743
Gold produced
Ounces
496,413
348,371
Gold refined and sold (IGO share)
Ounces
150,836
100,167
Cash Costs
$ per ounce produced
568
552
All-in Sustaining Costs ("AISC")**
$ per ounce sold
795
740
* 2014 refers to the period October 2013 to June 2014 being the period when the first full month of commissioning commenced.
** All-in Sustaining costs is a measure derived by the World Gold Council. On 27 June 2013, the Council released a publication outlining
definitions of both Cash Costs and All-in Sustaining Costs.
Independence Group NL
7