


 30 / 164

30 Independence Group NL
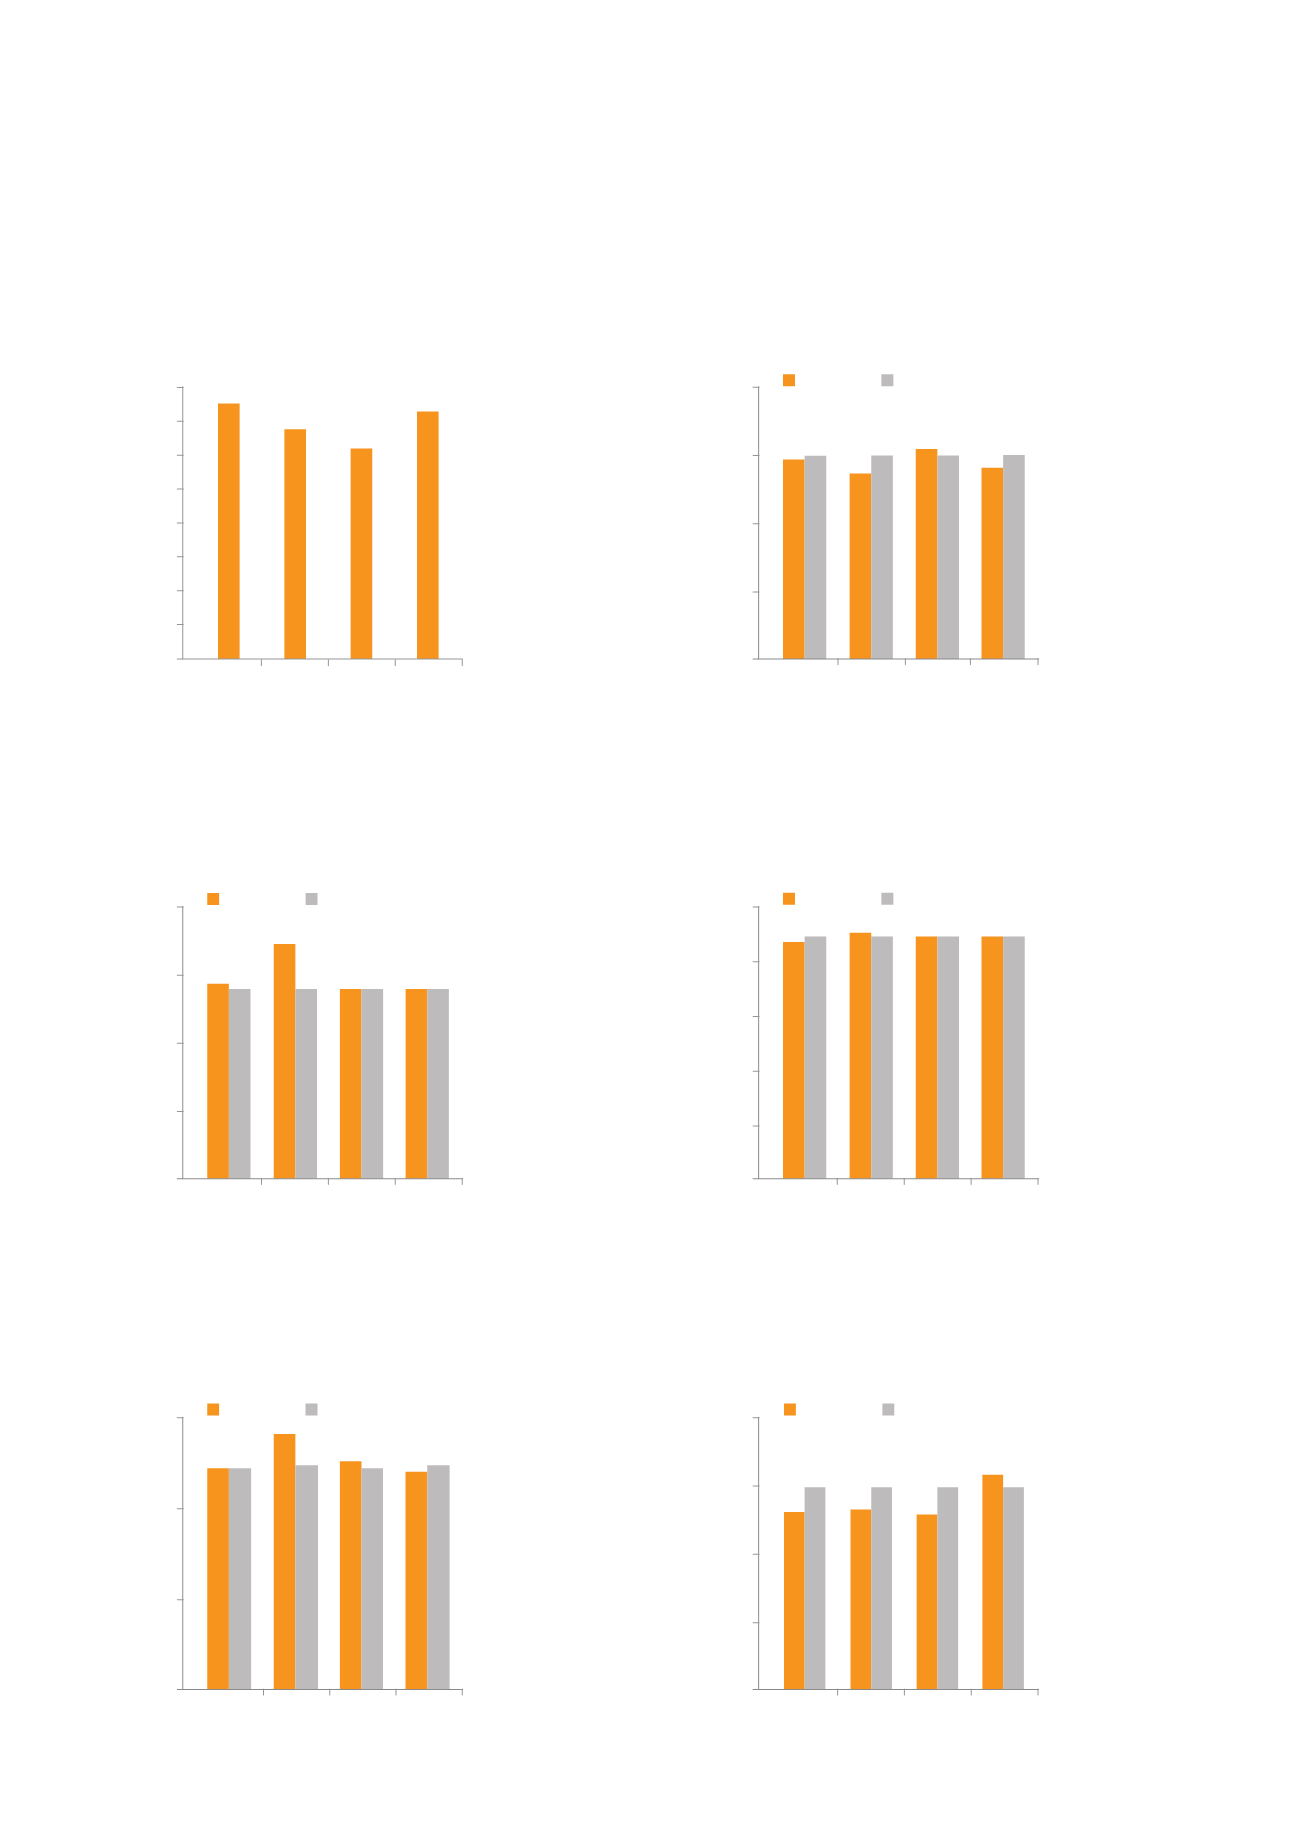
FY2015 Scorecard
FY2015 gold production and cash costs were better than original guidance and the mine delivered consistent performance across most metrics
over all quarters.
Total Mined (Mt)
Q4
Q2
Q3
Q1
16
14
12
10
8
6
4
2
0
Mill Throughput (Mt)
Q4
Q2
Q3
Q1
2.0
1.5
1.0
0.5
0.0
Actual
Guidance
Milled Grade (g/t)
Q4
Q2
Q3
Q1
4.0
3.0
2.0
1.0
0.0
Actual
Guidance
Gold Recovery (%)
Q4
Q2
Q3
Q1
Actual
Guidance Midpoint
100
80
60
40
20
0
Gold Production (koz)
Q4
Q2
Q3
Q1
Actual
Guidance
150
100
50
0
Cash Costs ($/oz)
Q4
Q2
Q3
Q1
Actual
Guidance Midpoint
800
600
400
200
0